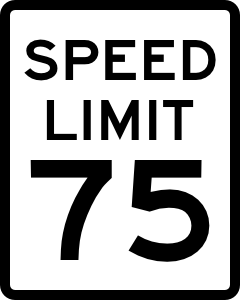
NTTA should set 75 mph speed limits

75 MPH speed limit signThe North Texas Tollway Authority (NTTA) can set 75 mph speed limits on much of its road system.

HB 1353, which was effective Sept. 1, 2011, basically says any road can have a 75 MPH speed limit (full text) if justified by TxDOT’s speed zoning procedure. Before then, 75 mph was only allowed in a few, politically-chosen  counties.

This speed zoning procedure generally requires the speed limit to be set at the 85th percentile speed of traffic.

What’s the 85th percentile speed? It’s the upper end of the “flow of traffic”.

Speed limits set at the 85th percentile speeds fully legalize this “flow of traffic”–the speeds of reasonable drivers–and only criminalizes demonstrably unsafe speeds. (more info)

What’s the 85th percentile speeds on NTTA roads?

Texas 121 TollOn the Sam Rayburn Tollway (TX 121), the average 85th percentile speed across the entire roadway is 74.1 mph. That rounds to 75 mph. Virtually all of the tolled part of TX 121 could be set to 75 mph with no hassle.

How about thePresident George Bush Turnpike logo President George Bush Turnpike? Not so fast. (Ha ha, get the pun?) 7 year old data has the entire road averaging a 71 mph 85th percentile speed. But wait, there’s more! 7 years ago, its speed limit was 60 mph! The speed limit is now 70, so the 85th percentile speeds have probably crept up. Plus there’s the new eastern extension, which may have changed traffic patterns. This entire road needs to be rechecked!
Dallas North Tollway logoThe last road is the Dallas North Tollway. It’s surprising:

  • Between I-35E and I-635 has a 73 mph 85th percentile speed! That rounds to 75 mph! It’s debatable if the sag curves under many of the bridges really need a 50 mph advisory speed. If that could be dispensed with, or raised to, say, 60 mph, then you could easily see a 70 or 75 mph limit on the old part of the DNT!
  • Between I-635 and the Collin County Line: 69 mph. This part could go to 70 mph.
  • Between the Collin County line and Sam Rayburn (TX-121): 73 mph, another 75 mph candidate!
  • Between 121 and the northern end: Surprisingly, only 69 mph! So the 70 mph limit there wouldn’t be changed. However, this measurement was taken when the speed limit was only 65. It’s 70 now, so the speed could have crept up a hair. This section needs to be rechecked.

If NTTA strictly followed the 85th percentile rule (which is only fair, since we motorists are expected to strictly obey traffic laws), and didn’t use arbitrary “engineering judgment” to force lower limits, we could see 75 mph limits on most of its road network.*

*A caveat: Because of a pointless, broken program called environmental speed limits, there may be red tape to raising the speed limit on DNT between Frankford Rd. and SRT (TX-121) and PGBT between I-35E and TX 78. None of the rest of the NTTA road system is subject to this program.

Here’s the raw data from NTTA: ORR-2-21-2012. This has the Excel files and strip maps. The Excel files have the speed checks. You’ll use the percentile function to get each location’s 85th percentile speed. The strip maps show where each speed check was run.

Comparing current data to last time period’s data in Postgres

I have a Postgres table where each row shows the number of traffic tickets written by each city per month.

I needed to show the percentage change between the current and prior month’s ticketwriting. For example, if a city wrote 1000 tickets this month and 500 last month, then I wanted a field in the row for this month to show a 200% increase over last month.

Here’s how I did it.

I first had to create two functions:

-- number of traffic tickets for
-- the given month and city
CREATE FUNCTION traffictickets(
                   cityName CHARACTER VARYING,
                   MONTH TIMESTAMP WITHOUT TIME zone
                ) RETURNS INTEGER
     AS 'select "TrafficTickets"
         FROM raw."OCA tickets per city"
         WHERE "Date" = $2 AND "City" = $1;'
     LANGUAGE SQL
     IMMUTABLE
     RETURNS NULL ON NULL INPUT;

Then I made a short SQL script that referenced this function:

UPDATE raw."OCA tickets per city"
     SET "Change" = "TrafficTickets"::REAL /
        (CASE WHEN traffictickets("City", "Date" - INTERVAL '1 month') = 0
         THEN -1
         ELSE traffictickets("City", "Date" - INTERVAL '1 month')
         END)::REAL;

Viola, now each of my rows shows the percentage change between the current and prior month’s ticket counts! Except there’s a huge problem–the changes aren’t consistently meaningful.

If ticketwriting dropped month over month, the change field will be between 0 and 1: going from 100 tickets to 20 tickets the next month, the change is 0.2. But here’s the problem: if ticketwriting increased, the number will be between 1 and infinity. If ticketwritng increased from 20 to 100, the change is 5. Or if it changed from 2 to 150, the change is 75!

Yikes, I need some way of bringing these positive changes down to Earth.

I think I have a solution: show the change relative to the city’s average ticketwriting over all its years in my database.

I added a new function:

-- average number of traffic tickets written by
-- that city over all months in my table
CREATE FUNCTION averageticketsforcity(
                   cityName CHARACTER VARYING
                ) RETURNS REAL
     AS 'select avg("TrafficTickets"::real)::real
         FROM raw."OCA tickets per city"
         WHERE "City" = $1;'
     LANGUAGE SQL
     IMMUTABLE
     RETURNS NULL ON NULL INPUT;

Here’s the new version of the query:

UPDATE raw."OCA tickets per city"
     SET "Change" = ("TrafficTickets"::REAL -
      traffictickets("City", "Date" - INTERVAL '1 month')::REAL) /
      CASE WHEN averageticketsforcity("City") = 0
        THEN 1
        ELSE averageticketsforcity("City")
      END;

That seems to have fixed it. Now all my values appear to be equally meaningful to each other.

Is Flying Colors Sports’s Great Amazing Race a scam?

(UPDATE: Flying Colors Sports’s owner Greg Benton posted a response in the comments below.)

Yesterday, my son and I did a family race.

It was called the Great Amazing Race, put on by Flying Color Sports. It’s supposedly a lighter version of the same thing you can see on TV.

It was neither great nor amazing.

It’s presented like a charity:

Here’s a problem: this “charity” has the patina of a loose, for-profit operation:

  • No IRS-recognized charities have names beginning with “flying colors sports” or “active families“. In fact, Flying Colors Sports is an Ohio for-profit LLC that was chartered in 2004. Ohio had no business on record beginning with “active families”. (Search for yourself.)
  • Through Google, I can’t find clear evidence of anything charitable these Active Families 30 or Active Families 60 charities have done, or that they even exist!
  • The event organizer said Akwasi Owusu-Ansah was supposed to attend but couldn’t because he was just traded. Um, no. It was January 15. He had been traded 6 weeks prior, on Dec. 4.
  • Poorly run, disorganized event, especially for something that cost between $30 and $50 per family.
  • No trained medical staff, or if they were there, they were well-hidden.
  • Was run worse than many free Cub or Boy Scout events I’ve been to.
  • Low-quality, sloppy web site with poor poorfreading, like “Norbuck Par” or “I-365” (it’s I-635!). In fact, it’s just thrown together with Godaddy’s free Website Tonight tool (see bottom of most pages).
  • The promised race packet was just a green, generic bifold flyer with no useful event details.
  • Credit card data is transmitted with no security and converted to email, which is inherently insecure.
  • No runner identification whatsoever. It’s all on an honor system basis. I could have easily scammed my way into the event.
  • Instead of “8 fun-filled stations“, there were six, and they were silly: 1. blindfolded guide, 2. sponge relay, 3. mummy wrap with toilet paper, 4. golfing a tennis ball into a hula hoop, 5. “hold the football between your legs while you go around some cones” and 6. a bingo game. Yes, the last station is really a game of chance, where you watch slower people get lucky and pass you up! Sure, these were enjoyable, but not $30-$50 per team enjoyable!
  • Purportedly tax-deductible donations are to be sent to the private residence of Donald and Karen S. Helton at 7858 Red Fox Drive, West Chester OH 45069.
  • The company’s headquarters are at the private residence of Gregory L. and Michelle R. Benton at 8270 Miranda Place, West Chester OH 45069.

So what’s the truth? Is there really any charity behind this?

I don’t know.

It could be that this is all legit, and some charity puts on an overpriced, over-promoted, hokey event run by a marketing firm that communicates poorly.

But it’s also possible that this is only a for-profit enterprise. If that’s true, it would be shameful. They would be getting undeserved free labor, and they would pretty much be pocketing money from families’ charity budgets.

Either way, participants deserve the truth, and they deserve something better than a brief, sloppy event for $30-$50, and taxpayers deserve for a charity to be organized properly, with IRS recognition.