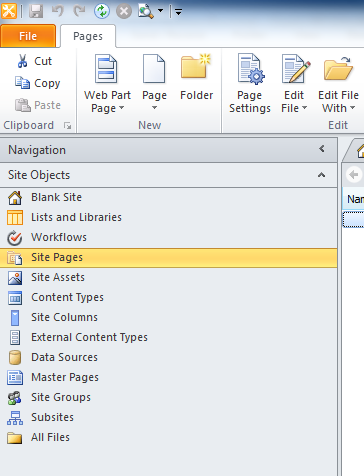
The CIO asked me for a technical diagram. Here it is. Yes, I really made this as my technical diagram. (Sorry, have to blank out a small part!)
Yes, he liked it.

The CIO asked me for a technical diagram. Here it is. Yes, I really made this as my technical diagram. (Sorry, have to blank out a small part!)
Yes, he liked it.

(UPDATE: Flying Colors Sports’s owner Greg Benton posted a response in the comments below.)
Yesterday, my son and I did a family race.
It was called the Great Amazing Race, put on by Flying Color Sports. It’s supposedly a lighter version of the same thing you can see on TV.
It was neither great nor amazing.
It’s presented like a charity:
Here’s a problem: this “charity” has the patina of a loose, for-profit operation:
So what’s the truth? Is there really any charity behind this?
I don’t know.
It could be that this is all legit, and some charity puts on an overpriced, over-promoted, hokey event run by a marketing firm that communicates poorly.
But it’s also possible that this is only a for-profit enterprise. If that’s true, it would be shameful. They would be getting undeserved free labor, and they would pretty much be pocketing money from families’ charity budgets.
Either way, participants deserve the truth, and they deserve something better than a brief, sloppy event for $30-$50, and taxpayers deserve for a charity to be organized properly, with IRS recognition.
 This explains how to show addresses in a SharePoint 2010 list on a Google Map.
This article is based on Kyle Shaeffer’s Plotting Your SharePoint 2010 List Data on a Google Map. The main difference is I upgraded his method to Google Maps API V3.
Here’s how it’s done:
Using SharePoint Designer 2010 (free download!), open your SharePoint site and:
 . Name it Address.
Still in SharePoint Designer 2010:

Now you’ll see your data in a table in the page.
You’ll need to reference two script libraries: Google’s Maps API and jQuery.
Find the opening <form> element in the source code. Right after it, paste this code:
<script type="text/javascript" src="https://maps.googleapis.com/maps/api/js?key=API_KEY_GOES_HERE&sensor=false"></script> <script type="text/javascript" src="https://ajax.googleapis.com/ajax/libs/jquery/1.7.1/jquery.min.js"></script> <div id="map_canvas" style="width: 98%; height: 400px"></div> <script type="text/javascript"> // set up the basic map object var latlng = new google.maps.LatLng(34.603885, -4.626009); var myOptions = { zoom: 2, center: latlng, mapTypeId: google.maps.MapTypeId.ROADMAP }; var map = new google.maps.Map(document.getElementById("map_canvas"), myOptions); // this is used for geocoding var geocoder = new google.maps.Geocoder(); function codeAddress(address, theName) { geocoder.geocode( { 'address': address}, function(results, status) { if (status == google.maps.GeocoderStatus.OK) { var marker = new google.maps.Marker({ map: map, position: results[0].geometry.location }); } else { alert("Geocode was not successful for the following reason: " + status); } }); } // this is called with body's onload to pull addresses after the page is done loading. function initialize() { $("tr.ms-itmhover").each(function(i){ codeAddress($(this).find('.ms-rtestate-field:eq(0)').text(), $(this).find('.ms-vb-title:eq(0) a').text()); }); } </script> |
Replace API_KEY_GOES_HERE with your own Google API key. Don’t have one? Get it at https://code.google.com/apis/console/. Be sure to get a Google Maps API v3 key! v2 is deprecated.
Now you need to add an onload attribute to your body tag to fire off the initialize function:
<body onload="initialize()"> |
Viola! You have a map that dynamically pulls from the below list!
The initialize method works by scraping from the rendered HTML. It’s finding every tr with class ms-itmhover–which is what is produced by the data view you inserted above. Then within each of those trs, it finds:
You’ll have to do JavaScript surgery if you change fields in a way that alters this. For example, if another multi line text field displays before your address, you’ll have to change .ms-rtestate-field:eq(0) to .ms-rtestate-field:eq(1). Or you’ll need to alter the XSLT behind the data view to produce some other classes or code.
Also, because this uses JavaScript to scrape the screen’s contents, you must deliver the data list in the page . It doesn’t have to be visible–you can make it invisible with CSS. If you don’t want the data to be on the page, you’ll need to use more sophisticated techniques, possibly some kind of AJAX.