In the past few days, the nanny-state, safety-theater goons have influenced the newspapers with creative spin on recent road safety statistics. The headlines alert us that that roadway deaths are at their highest levels in 15 years, implying we have dangerous highways that need urgent solutions!
That is hogwash.
It is true that highway deaths increased 1.4% in 2005, the most recent available year. If I left it at that, you might believe that we’re reversing decades-old safety trends. Here’s why that is a faulty conclusion.
Cannot Ignore Exposure
If you spend 1 hour in 0 degree weather, you have a higher chance of suffering hypothermia than if you spend 1 minute in it. Increased exposure to cold increases your likelihood of hypothermia. Likewise, if you drive 100 miles each day, you have a higher likelihood of being involved in a crash than if you drive 1 mile. Your increased mileage exposed you to more risk.
Aggregate that to a national scale: if all the drivers in a nation drive more miles each year, then the nation as a whole have experience more deaths, not because each driver is more dangerous, but because the nation has increased its exposure to risk.
The total death count by itself does not shed much light on the total safety picture. You must to scale the death count by risk exposure–miles driven.
Go back to that hypothermia example. Suppose we do a larger experiment. On day 1, 10 people go outside for 1 hour in the 0 degree weather, and one person gets hypothermia. You might infer that each individual has a 10% chance of getting hypothermia.
Suppose we repeat the same experiment with 50 people, and 4 people get hypothermia. The chance of any individual getting hypothermia decreased by 20%! How could that be? Didn’t hypothermia cases quadruple? In fact, the risk–that is, the number of people in the cold–increased fivefold. That is a much larger increase than the increase in actual cases of hypothermia.
Similarly, if risk–miles driven–increases more rapidly than total deaths, then your roads are actually safer, despite the increased death count, because the chance of any individual dying on the road is decreasing!
The Nitty Gritty
From 1995 through 2005, the number of vehicle miles driven annually (VMT) has risen by an average 2.1%. However, over that same time period, the total death count has risen by an annual 0.6%. This suggests that the death rate is decreasing. Our highways have been getting safer despite the increased death count! Here is a chart comparing deaths to vehicle miles traveled since 1966, with trend lines to show the long-term trends:
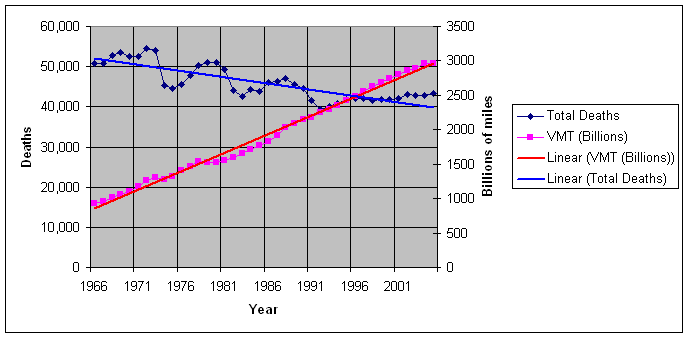
Clearly, the VMT count is rising much more quickly than the death count.
From 1995 through 2005, the death rate decreased by an average of 1.5% per year. It decreased every year except for 2005. Is 2005’s number alarming? I say no.
In 1995, the death rate was 1.73 deaths per hundred million miles traveled. In 2005, the death rate was 1.47. That’s a 15% decrease!
Digging a little further into the statistics shows a smoking gun.
Blame Motorcyclists
The yearly death count for motorcyclists has skyrocketed. In fact, on average, motorcyclist deaths have increased about 40 times faster than passenger vehicles every year from 1997 through 2005. Here’s a chart:
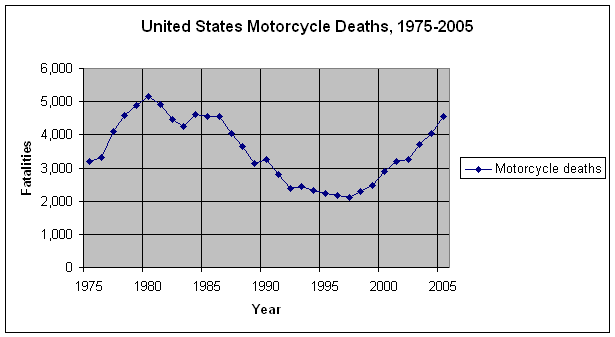
What’s going on? Two things: there are many more motorcycles on the roads than before, and most states’ helmet laws have been repealed in the past 10 years. Today, only 20 states have full motorcycle helmet laws.
What would happen if motorcycle death increases equaled instead of grossly outpaced passenger vehicle death count increases? Here’s how the numbers would change if we used an adjusted death count:
- The adjusted 2005 death rate would be only 1.39, which would mean a one third increase in the death rate reduction from 2005.
- The adjusted 2005 death rate would only be 0.1% higher than the adjusted 2004 rate.
Perspective
Road safety nanny state types nostalgically look back on the days of the old national 55 mph limit. Look at this chart, showing actual death rates against time:

Notice how roads today are substantially safer today than in ’74, when the 55 mph limit started? (This is a separate point deserving more research, but also notice how the death rate flattened–didn’t meaningfully improve–in the 8 years following the 55 mph limit and actually turned back the excellent safety improvement record from 1966-1973? Is this causation or correlation?)
Also note how we are starting to hit against the law of diminishing returns: the closer the death rate gets to 0, the more difficult it becomes to further reduce the rate using the same techniques.
Lesson Learned?
While there was a setback in traffic safety in 2005, it was miniscule, and its is likely to be mostly correlated with motorcycle deaths.
No deaths are good deaths. Ideally, no traffic deaths should happen. But painting a picture of doom and gloom with silly statements that castigate all drivers focuses energies on unproductive measures like low speed limits.
Data Sources
My data came from two NHTSA sources: the Fatality Analysis Reporting System and Traffic Safety Facts 1997. Here’s the spreadsheet where I crunched my data.